Luftforurening i Calgary: Real-time Air Quality Index og smog alarm.
Prognoser for forurening og luftkvalitet for Calgary. I dag er onsdag den 24. juni 2026. Følgende luftforureningsværdier er blevet registreret for Calgary:- partikler (PM2,5) støv - 5 (God)
- kulilte (CO) - 0 (God)
- ozon (O3) - 0 (God)
- nitrogendioxid (NO2) - 0 (God)

Hvad er luftkvaliteten i Calgary dag? Er luften forurenet i Calgary?. Er der smog?
Hvad er det nuværende niveau for PM2,5 i Calgary? (partikler (PM2,5) støv)
Dagens PM2.5 niveau er:
5 (God)
Til sammenligning var det højeste niveau af PM2,5 i Calgary i de sidste 7 dage: 9 (fredag den 12. april 2024) og det laveste: 2 (onsdag den 10. april 2024).
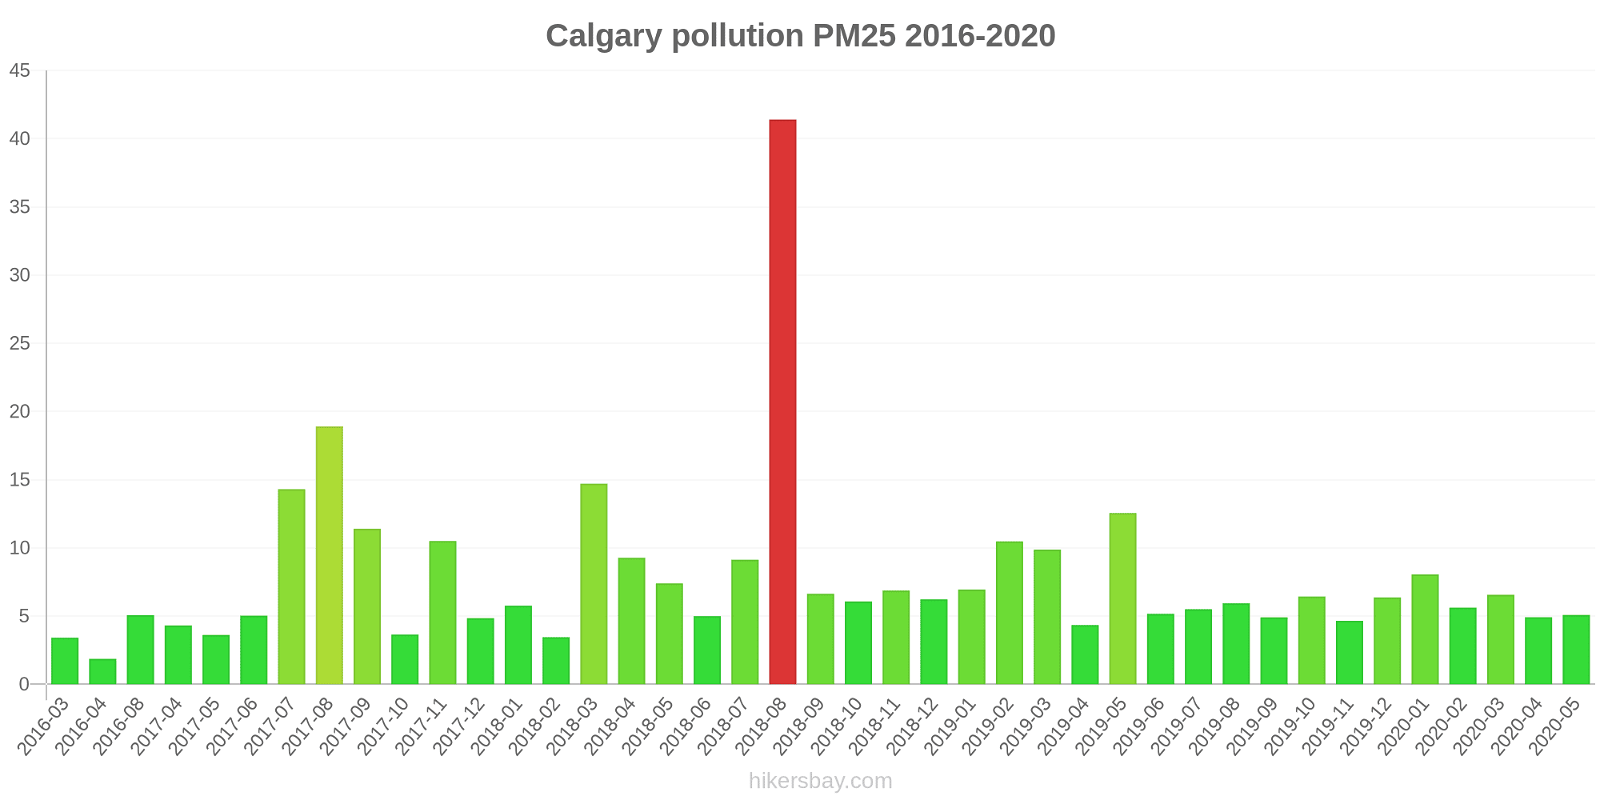
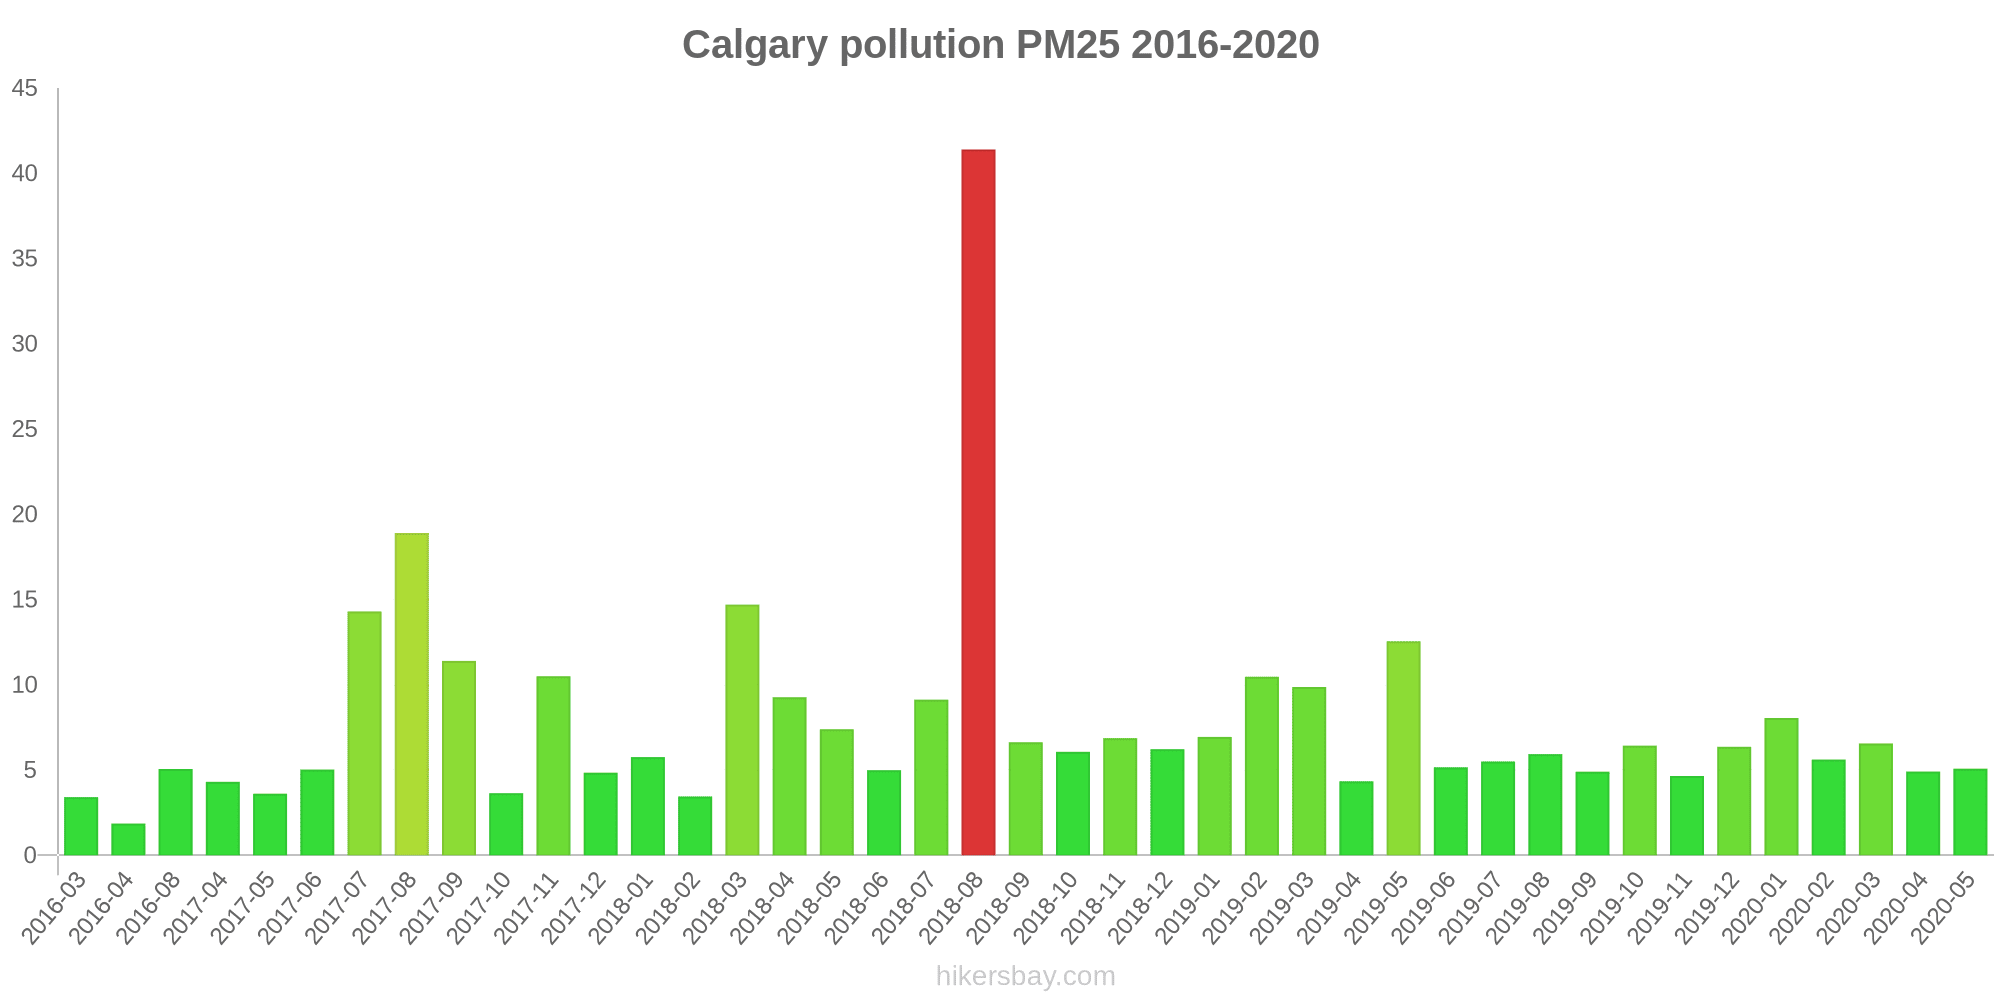
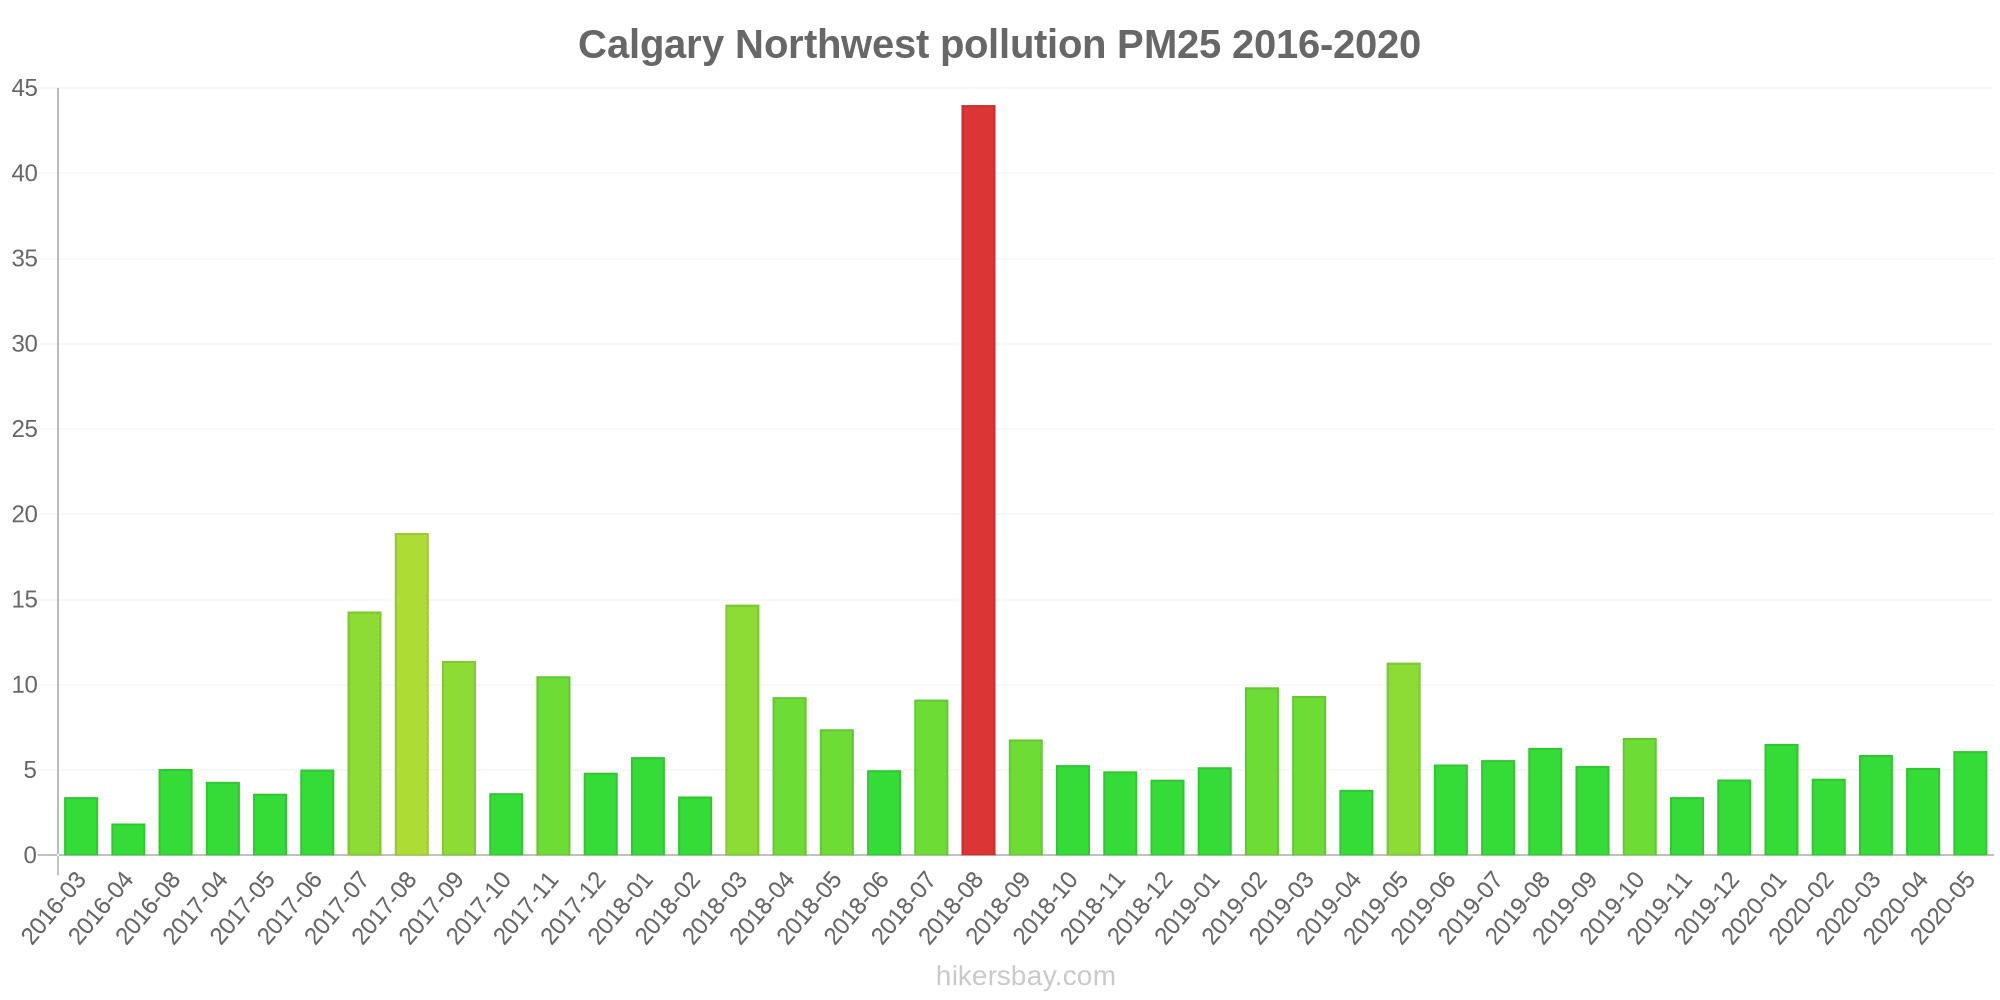
De højeste PM2,5-værdier blev registreret: 41 (august 2018).
Det laveste niveau af partikler PM2,5 forurening forekommer i måned: april (1.9).
Hvor højt er CO-niveauet? (kulilte (CO))
0 (God)
Hvordan er O3-niveauet i dag i Calgary? (ozon (O3))
0 (God)
Hvor højt er niveauet af NO2? (nitrogendioxid (NO2))
0 (God)
Aktuelle data tirsdag den 16. april 2024 10.00
PM2,5 5 (God)
CO 0 (God)
O3 0 (God)
NO2 0 (God)
Data om luftforurening fra de seneste dage i Calgary
index
2024-04-09
2024-04-10
2024-04-11
2024-04-12
2024-04-13
2024-04-14
2024-04-15
2024-04-16
o3
0
Good
0
Good
0
Good
0
Good
0
Good
0
Good
0
Good
0
Good
pm25
5
Good
2
Good
6
Good
9
Good
6
Good
5
Good
7
Good
5
Good
no2
0
Good
0
Good
0
Good
0
Good
0
Good
0
Good
0
Good
0
Good
co
0
Good
0
Good
0
Good
0
Good
0
Good
0
Good
0
Good
0
Good
data source »
Luftforurening i Calgary fra marts 2016 til maj 2020
index
2020-05
2020-04
2020-03
2020-02
2020-01
2019-12
2019-11
2019-10
2019-09
2019-08
2019-07
2019-06
2019-05
2019-04
2019-03
2019-02
2019-01
2018-12
2018-11
2018-10
2018-09
2018-08
2018-07
2018-06
2018-05
2018-04
2018-03
2018-02
2018-01
2017-12
2017-11
2017-10
2017-09
2017-08
2017-07
2017-06
2017-05
2017-04
2016-09
2016-08
2016-04
2016-03
co:ppm
0.33 (Good)
0.3 (Good)
0.38 (Good)
0.39 (Good)
0.41 (Good)
0.5 (Good)
0.41 (Good)
0.34 (Good)
0.24 (Good)
0.21 (Good)
0.14 (Good)
0.15 (Good)
0.2 (Good)
0.27 (Good)
0.34 (Good)
0.35 (Good)
0.49 (Good)
0.41 (Good)
0.57 (Good)
0.42 (Good)
0.29 (Good)
0.52 (Good)
0.16 (Good)
0.09 (Good)
0.08 (Good)
0.07 (Good)
0.59 (Good)
0.2 (Good)
0.22 (Good)
0.23 (Good)
0.24 (Good)
0.17 (Good)
0.24 (Good)
0.3 (Good)
0.06 (Good)
0.05 (Good)
0.05 (Good)
0.02 (Good)
0.15 (Good)
0.19 (Good)
0.45 (Good)
0.28 (Good)
no2:ppm
0.01 (Good)
0.01 (Good)
0.01 (Good)
0.02 (Good)
0.02 (Good)
0.02 (Good)
0.02 (Good)
0.01 (Good)
0.01 (Good)
0.01 (Good)
0.01 (Good)
0.01 (Good)
0.01 (Good)
0.01 (Good)
0.02 (Good)
0.02 (Good)
0.02 (Good)
0.02 (Good)
0.03 (Good)
0.01 (Good)
0.01 (Good)
0.01 (Good)
0 (Good)
0 (Good)
0.01 (Good)
0.01 (Good)
0.02 (Good)
0.01 (Good)
0.02 (Good)
0.01 (Good)
0.02 (Good)
0.01 (Good)
0.01 (Good)
0.01 (Good)
0.01 (Good)
0 (Good)
0.01 (Good)
0.01 (Good)
0 (Good)
0.01 (Good)
- (Good)
0.01 (Good)
o3:ppm
0.04 (Good)
0.04 (Good)
0.03 (Good)
0.02 (Good)
0.02 (Good)
0.02 (Good)
0.02 (Good)
0.02 (Good)
0.02 (Good)
0.03 (Good)
0.03 (Good)
0.03 (Good)
0.03 (Good)
0.03 (Good)
0.03 (Good)
0.02 (Good)
0.02 (Good)
0.02 (Good)
0.01 (Good)
0.02 (Good)
0.01 (Good)
0.03 (Good)
0.04 (Good)
0.04 (Good)
0.04 (Good)
0.04 (Good)
0.03 (Good)
0.03 (Good)
0.02 (Good)
0.02 (Good)
0.02 (Good)
0.02 (Good)
0.03 (Good)
0.03 (Good)
0.04 (Good)
0.03 (Good)
0.03 (Good)
0.03 (Good)
0.02 (Good)
0.02 (Good)
0.04 (Good)
0.03 (Good)
pm25
5.1 (Good)
4.9 (Good)
6.6 (Good)
5.6 (Good)
8.1 (Good)
6.4 (Good)
4.7 (Good)
6.4 (Good)
4.9 (Good)
5.9 (Good)
5.5 (Good)
5.2 (Good)
13 (Good)
4.3 (Good)
9.9 (Good)
10 (Good)
6.9 (Good)
6.2 (Good)
6.9 (Good)
6.1 (Good)
6.6 (Good)
41 (Unhealthy for Sensitive Groups)
9.1 (Good)
5 (Good)
7.4 (Good)
9.3 (Good)
15 (Moderate)
3.5 (Good)
5.8 (Good)
4.8 (Good)
11 (Good)
3.6 (Good)
11 (Good)
19 (Moderate)
14 (Moderate)
5 (Good)
3.6 (Good)
4.3 (Good)
- (Good)
5.1 (Good)
1.9 (Good)
3.4 (Good)
data source »
Livskvalitet i Calgary
Grønne og parker i byen
Calgary
78 %
USA: 70 %
Venezuela: 41 %
Island: 72 %
partikler PM2,5
Calgary
8 (Good)
Fornøjelse at tilbringe tid i byen
Calgary
81 %
USA: 75 %
Bahamas: 53 %
Venezuela: 41 %
Island: 89 %
partikler PM10
Calgary
14 (Good)
Luftforurening
Calgary
21 %
USA: 29 %
Bahamas: 52 %
Venezuela: 59 %
Island: 13 %
Bortskaffelse af affald
Calgary
78 %
USA: 71 %
Bahamas: 29 %
Venezuela: 18 %
Island: 79 %
Drikkevandets tilgængelighed og kvalitet
Calgary
86 %
USA: 71 %
Bahamas: 55 %
Venezuela: 28 %
Island: 96 %
Renlighed og ryddelighed
Calgary
74 %
USA: 60 %
Bahamas: 35 %
Venezuela: 22 %
Island: 75 %
Støj- og lysforurening
Calgary
41 %
USA: 47 %
Bahamas: 39 %
Venezuela: 47 %
Island: 23 %
Vandforurening
Calgary
28 %
USA: 44 %
Bahamas: 58 %
Venezuela: 76 %
Island: 8,4 %
Source: Numbeo
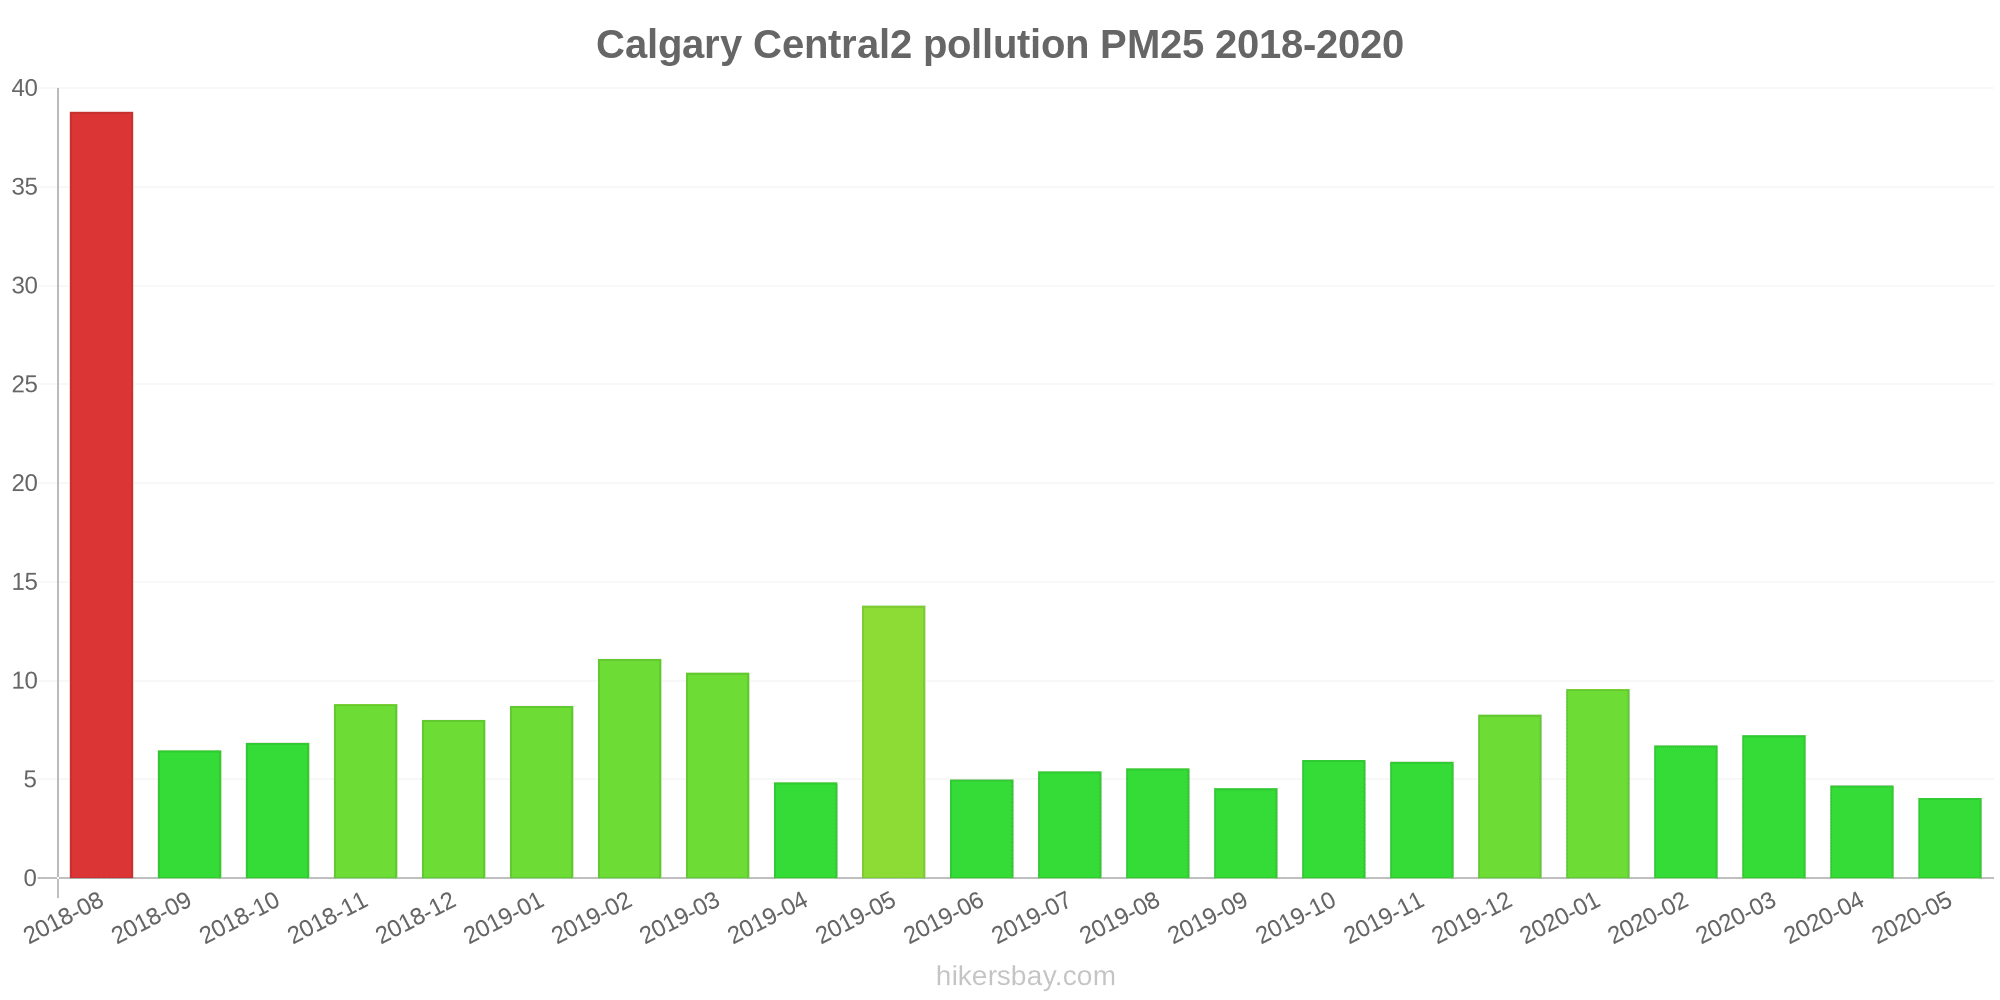
Calgary Central2
tirsdag den 16. april 2024 10.00
PM2,5 5.4 (God)
partikler (PM2,5) støv
CO 0.2 (God)
kulilte (CO)
O3 0.04 (God)
ozon (O3)
NO2 0.01 (God)
nitrogendioxid (NO2)
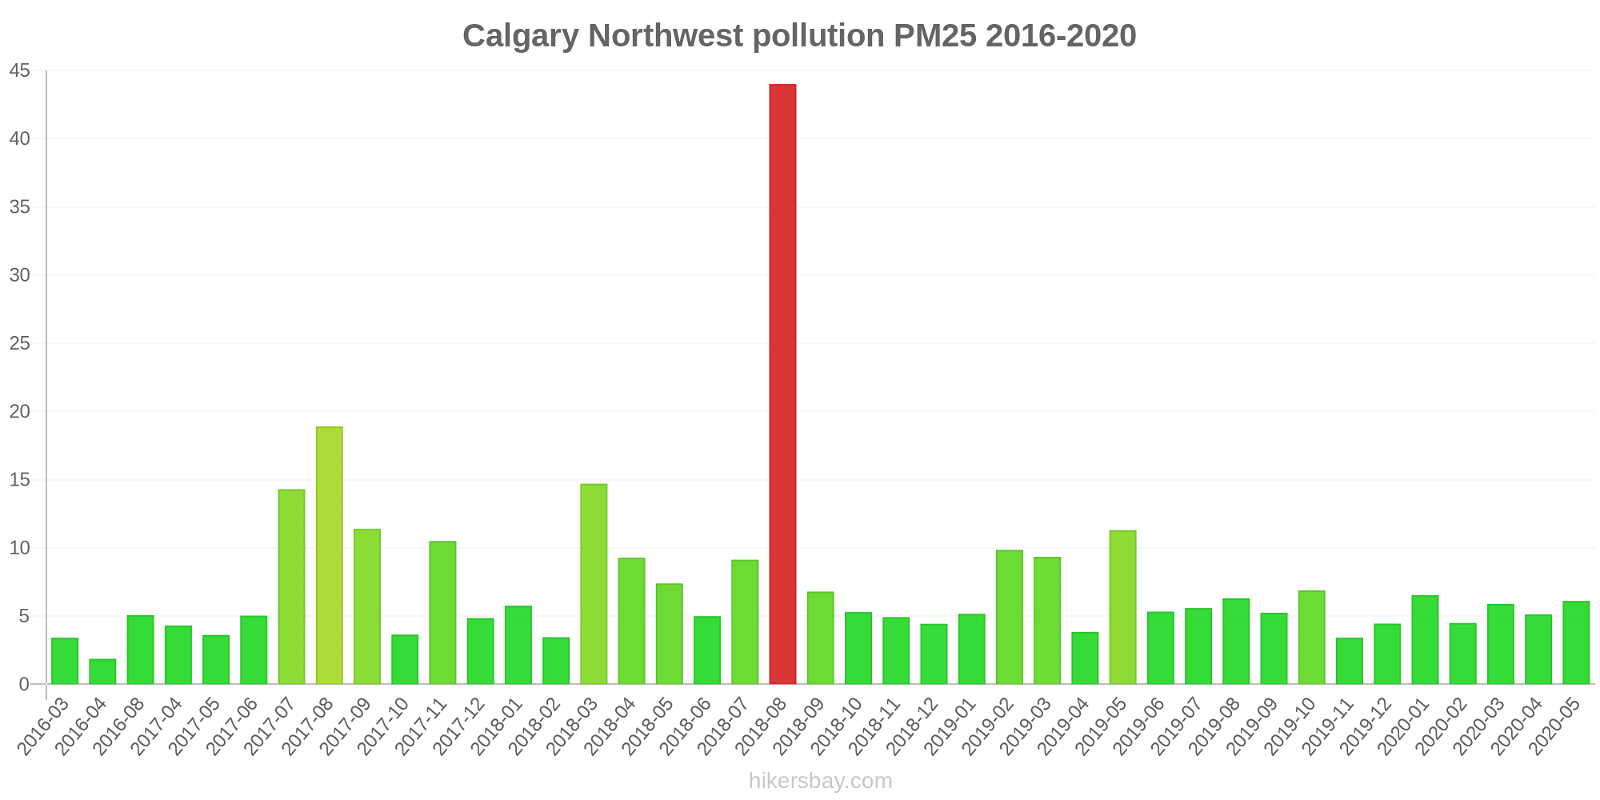
Calgary Northwest
tirsdag den 16. april 2024 10.00
PM2,5 4.2 (God)
partikler (PM2,5) støv
NO2 0 (God)
nitrogendioxid (NO2)
CO 0.3 (God)
kulilte (CO)
O3 0.04 (God)
ozon (O3)
Calgary Central2
index
2024-04-16
2024-04-15
2024-04-14
2024-04-13
2024-04-12
2024-04-11
2024-04-10
2024-04-09
o3
0.04
0.04
0.04
0.03
0.03
0.03
0.03
0.03
pm25
5.5
7.3
5.3
5.7
9.1
6.8
2.6
6
no2
0.01
0.01
0.01
0.01
0.02
0.01
0.01
0.02
co
0.2
0.21
0.18
0.2
0.31
0.23
0.2
0.24
Calgary Northwest
index
2024-04-16
2024-04-15
2024-04-14
2024-04-13
2024-04-12
2024-04-11
2024-04-10
2024-04-09
o3
0.04
0.04
0.04
0.04
0.04
0.03
0.04
0.03
no2
0
0.01
0.01
0.01
0.01
0.01
0.01
0.01
pm25
4.5
6.1
4.8
5.9
8.7
5.3
2.1
3.9
co
0.3
0.32
0.3
0.32
0.34
0.37
0.34
0.35
Calgary Central2
2018-08 2020-05

index
2020-05
2020-04
2020-03
2020-02
2020-01
2019-12
2019-11
2019-10
2019-09
2019-08
2019-07
2019-06
2019-05
2019-04
2019-03
2019-02
2019-01
2018-12
2018-11
2018-10
2018-09
2018-08
co:ppm
0.44
0.32
0.33
0.4
0.36
0.52
0.42
0.32
0.2
0.23
0.18
0.16
0.18
0.35
0.34
0.41
0.5
0.46
0.5
0.37
0.28
0.58
no2:ppm
0.01
0.01
0.01
0.02
0.03
0.03
0.02
0.02
0.01
0.01
0.01
0.01
0.01
0.01
0.02
0.02
0.02
0.03
0.04
0.01
0.01
0.01
o3:ppm
0.03
0.04
0.03
0.02
0.01
0.01
0.01
0.02
0.02
0.02
0.03
0.03
0.03
0.03
0.03
0.02
0.01
0.01
0.01
0.02
0.01
0.02
pm25
4.1
4.7
7.2
6.7
9.6
8.3
5.9
6
4.6
5.6
5.4
5
14
4.8
10
11
8.7
8
8.8
6.8
6.5
39
Calgary Northwest
2016-03 2020-05
index
2020-05
2020-04
2020-03
2020-02
2020-01
2019-12
2019-11
2019-10
2019-09
2019-08
2019-07
2019-06
2019-05
2019-04
2019-03
2019-02
2019-01
2018-12
2018-11
2018-10
2018-09
2018-08
2018-07
2018-06
2018-05
2018-04
2018-03
2018-02
2018-01
2017-12
2017-11
2017-10
2017-09
2017-08
2017-07
2017-06
2017-05
2017-04
2016-09
2016-08
2016-04
2016-03
o3:ppm
0.04
0.04
0.03
0.02
0.02
0.02
0.02
0.02
0.02
0.03
0.03
0.03
0.03
0.04
0.03
0.02
0.02
0.02
0.02
0.02
0.02
0.03
0.04
0.04
0.04
0.04
0.03
0.03
0.02
0.02
0.02
0.02
0.03
0.03
0.04
0.03
0.03
0.03
0.02
0.02
0.04
0.03
pm25
6.1
5.1
5.9
4.5
6.5
4.4
3.4
6.9
5.2
6.3
5.6
5.3
11
3.8
9.3
9.8
5.2
4.4
4.9
5.3
6.8
44
9.1
5
7.4
9.3
15
3.5
5.8
4.8
11
3.6
11
19
14
5
3.6
4.3
-
5.1
1.9
3.4
no2:ppm
0
0
0.01
0.01
0.02
0.02
0.01
0.01
0.01
0
0
0
0.01
0.01
0.01
0.02
0.02
0.02
0.02
0.01
0.01
0.01
0
0
0.01
0.01
0.02
0.01
0.02
0.01
0.02
0.01
0.01
0.01
0.01
0
0.01
0.01
0
0.01
-
0.01
co:ppm
0.22
0.29
0.43
0.38
0.46
0.48
0.4
0.37
0.27
0.19
0.09
0.14
0.22
0.2
0.34
0.3
0.47
0.35
0.64
0.47
0.3
0.46
0.16
0.09
0.08
0.07
0.59
0.2
0.22
0.23
0.24
0.17
0.24
0.3
0.06
0.05
0.05
0.02
0.15
0.19
0.45
0.28
* Pollution data source:
https://openaq.org
(AirNow)
The data is licensed under CC-By 4.0
PM2,5 5 (God)
CO 0 (God)
O3 0 (God)
NO2 0 (God)
Data om luftforurening fra de seneste dage i Calgary
| index | 2024-04-09 | 2024-04-10 | 2024-04-11 | 2024-04-12 | 2024-04-13 | 2024-04-14 | 2024-04-15 | 2024-04-16 |
|---|---|---|---|---|---|---|---|---|
| o3 | 0 Good |
0 Good |
0 Good |
0 Good |
0 Good |
0 Good |
0 Good |
0 Good |
| pm25 | 5 Good |
2 Good |
6 Good |
9 Good |
6 Good |
5 Good |
7 Good |
5 Good |
| no2 | 0 Good |
0 Good |
0 Good |
0 Good |
0 Good |
0 Good |
0 Good |
0 Good |
| co | 0 Good |
0 Good |
0 Good |
0 Good |
0 Good |
0 Good |
0 Good |
0 Good |
| index | 2020-05 | 2020-04 | 2020-03 | 2020-02 | 2020-01 | 2019-12 | 2019-11 | 2019-10 | 2019-09 | 2019-08 | 2019-07 | 2019-06 | 2019-05 | 2019-04 | 2019-03 | 2019-02 | 2019-01 | 2018-12 | 2018-11 | 2018-10 | 2018-09 | 2018-08 | 2018-07 | 2018-06 | 2018-05 | 2018-04 | 2018-03 | 2018-02 | 2018-01 | 2017-12 | 2017-11 | 2017-10 | 2017-09 | 2017-08 | 2017-07 | 2017-06 | 2017-05 | 2017-04 | 2016-09 | 2016-08 | 2016-04 | 2016-03 |
|---|---|---|---|---|---|---|---|---|---|---|---|---|---|---|---|---|---|---|---|---|---|---|---|---|---|---|---|---|---|---|---|---|---|---|---|---|---|---|---|---|---|---|
| co:ppm | 0.33 (Good) | 0.3 (Good) | 0.38 (Good) | 0.39 (Good) | 0.41 (Good) | 0.5 (Good) | 0.41 (Good) | 0.34 (Good) | 0.24 (Good) | 0.21 (Good) | 0.14 (Good) | 0.15 (Good) | 0.2 (Good) | 0.27 (Good) | 0.34 (Good) | 0.35 (Good) | 0.49 (Good) | 0.41 (Good) | 0.57 (Good) | 0.42 (Good) | 0.29 (Good) | 0.52 (Good) | 0.16 (Good) | 0.09 (Good) | 0.08 (Good) | 0.07 (Good) | 0.59 (Good) | 0.2 (Good) | 0.22 (Good) | 0.23 (Good) | 0.24 (Good) | 0.17 (Good) | 0.24 (Good) | 0.3 (Good) | 0.06 (Good) | 0.05 (Good) | 0.05 (Good) | 0.02 (Good) | 0.15 (Good) | 0.19 (Good) | 0.45 (Good) | 0.28 (Good) |
| no2:ppm | 0.01 (Good) | 0.01 (Good) | 0.01 (Good) | 0.02 (Good) | 0.02 (Good) | 0.02 (Good) | 0.02 (Good) | 0.01 (Good) | 0.01 (Good) | 0.01 (Good) | 0.01 (Good) | 0.01 (Good) | 0.01 (Good) | 0.01 (Good) | 0.02 (Good) | 0.02 (Good) | 0.02 (Good) | 0.02 (Good) | 0.03 (Good) | 0.01 (Good) | 0.01 (Good) | 0.01 (Good) | 0 (Good) | 0 (Good) | 0.01 (Good) | 0.01 (Good) | 0.02 (Good) | 0.01 (Good) | 0.02 (Good) | 0.01 (Good) | 0.02 (Good) | 0.01 (Good) | 0.01 (Good) | 0.01 (Good) | 0.01 (Good) | 0 (Good) | 0.01 (Good) | 0.01 (Good) | 0 (Good) | 0.01 (Good) | - (Good) | 0.01 (Good) |
| o3:ppm | 0.04 (Good) | 0.04 (Good) | 0.03 (Good) | 0.02 (Good) | 0.02 (Good) | 0.02 (Good) | 0.02 (Good) | 0.02 (Good) | 0.02 (Good) | 0.03 (Good) | 0.03 (Good) | 0.03 (Good) | 0.03 (Good) | 0.03 (Good) | 0.03 (Good) | 0.02 (Good) | 0.02 (Good) | 0.02 (Good) | 0.01 (Good) | 0.02 (Good) | 0.01 (Good) | 0.03 (Good) | 0.04 (Good) | 0.04 (Good) | 0.04 (Good) | 0.04 (Good) | 0.03 (Good) | 0.03 (Good) | 0.02 (Good) | 0.02 (Good) | 0.02 (Good) | 0.02 (Good) | 0.03 (Good) | 0.03 (Good) | 0.04 (Good) | 0.03 (Good) | 0.03 (Good) | 0.03 (Good) | 0.02 (Good) | 0.02 (Good) | 0.04 (Good) | 0.03 (Good) |
| pm25 | 5.1 (Good) | 4.9 (Good) | 6.6 (Good) | 5.6 (Good) | 8.1 (Good) | 6.4 (Good) | 4.7 (Good) | 6.4 (Good) | 4.9 (Good) | 5.9 (Good) | 5.5 (Good) | 5.2 (Good) | 13 (Good) | 4.3 (Good) | 9.9 (Good) | 10 (Good) | 6.9 (Good) | 6.2 (Good) | 6.9 (Good) | 6.1 (Good) | 6.6 (Good) | 41 (Unhealthy for Sensitive Groups) | 9.1 (Good) | 5 (Good) | 7.4 (Good) | 9.3 (Good) | 15 (Moderate) | 3.5 (Good) | 5.8 (Good) | 4.8 (Good) | 11 (Good) | 3.6 (Good) | 11 (Good) | 19 (Moderate) | 14 (Moderate) | 5 (Good) | 3.6 (Good) | 4.3 (Good) | - (Good) | 5.1 (Good) | 1.9 (Good) | 3.4 (Good) |
Grønne og parker i byen
Calgary 78 %
USA: 70 % Venezuela: 41 % Island: 72 %partikler PM2,5
Calgary 8 (Good)
Fornøjelse at tilbringe tid i byen
Calgary 81 %
USA: 75 % Bahamas: 53 % Venezuela: 41 % Island: 89 %partikler PM10
Calgary 14 (Good)
Luftforurening
Calgary 21 %
USA: 29 % Bahamas: 52 % Venezuela: 59 % Island: 13 %Bortskaffelse af affald
Calgary 78 %
USA: 71 % Bahamas: 29 % Venezuela: 18 % Island: 79 %Drikkevandets tilgængelighed og kvalitet
Calgary 86 %
USA: 71 % Bahamas: 55 % Venezuela: 28 % Island: 96 %Renlighed og ryddelighed
Calgary 74 %
USA: 60 % Bahamas: 35 % Venezuela: 22 % Island: 75 %Støj- og lysforurening
Calgary 41 %
USA: 47 % Bahamas: 39 % Venezuela: 47 % Island: 23 %Vandforurening
Calgary 28 %
USA: 44 % Bahamas: 58 % Venezuela: 76 % Island: 8,4 %PM2,5 5.4 (God)
partikler (PM2,5) støvCO 0.2 (God)
kulilte (CO)O3 0.04 (God)
ozon (O3)NO2 0.01 (God)
nitrogendioxid (NO2)PM2,5 4.2 (God)
partikler (PM2,5) støvNO2 0 (God)
nitrogendioxid (NO2)CO 0.3 (God)
kulilte (CO)O3 0.04 (God)
ozon (O3)Calgary Central2
| index | 2024-04-16 | 2024-04-15 | 2024-04-14 | 2024-04-13 | 2024-04-12 | 2024-04-11 | 2024-04-10 | 2024-04-09 |
|---|---|---|---|---|---|---|---|---|
| o3 | 0.04 | 0.04 | 0.04 | 0.03 | 0.03 | 0.03 | 0.03 | 0.03 |
| pm25 | 5.5 | 7.3 | 5.3 | 5.7 | 9.1 | 6.8 | 2.6 | 6 |
| no2 | 0.01 | 0.01 | 0.01 | 0.01 | 0.02 | 0.01 | 0.01 | 0.02 |
| co | 0.2 | 0.21 | 0.18 | 0.2 | 0.31 | 0.23 | 0.2 | 0.24 |
Calgary Northwest
| index | 2024-04-16 | 2024-04-15 | 2024-04-14 | 2024-04-13 | 2024-04-12 | 2024-04-11 | 2024-04-10 | 2024-04-09 |
|---|---|---|---|---|---|---|---|---|
| o3 | 0.04 | 0.04 | 0.04 | 0.04 | 0.04 | 0.03 | 0.04 | 0.03 |
| no2 | 0 | 0.01 | 0.01 | 0.01 | 0.01 | 0.01 | 0.01 | 0.01 |
| pm25 | 4.5 | 6.1 | 4.8 | 5.9 | 8.7 | 5.3 | 2.1 | 3.9 |
| co | 0.3 | 0.32 | 0.3 | 0.32 | 0.34 | 0.37 | 0.34 | 0.35 |
Calgary Central2
| index | 2020-05 | 2020-04 | 2020-03 | 2020-02 | 2020-01 | 2019-12 | 2019-11 | 2019-10 | 2019-09 | 2019-08 | 2019-07 | 2019-06 | 2019-05 | 2019-04 | 2019-03 | 2019-02 | 2019-01 | 2018-12 | 2018-11 | 2018-10 | 2018-09 | 2018-08 |
|---|---|---|---|---|---|---|---|---|---|---|---|---|---|---|---|---|---|---|---|---|---|---|
| co:ppm | 0.44 | 0.32 | 0.33 | 0.4 | 0.36 | 0.52 | 0.42 | 0.32 | 0.2 | 0.23 | 0.18 | 0.16 | 0.18 | 0.35 | 0.34 | 0.41 | 0.5 | 0.46 | 0.5 | 0.37 | 0.28 | 0.58 |
| no2:ppm | 0.01 | 0.01 | 0.01 | 0.02 | 0.03 | 0.03 | 0.02 | 0.02 | 0.01 | 0.01 | 0.01 | 0.01 | 0.01 | 0.01 | 0.02 | 0.02 | 0.02 | 0.03 | 0.04 | 0.01 | 0.01 | 0.01 |
| o3:ppm | 0.03 | 0.04 | 0.03 | 0.02 | 0.01 | 0.01 | 0.01 | 0.02 | 0.02 | 0.02 | 0.03 | 0.03 | 0.03 | 0.03 | 0.03 | 0.02 | 0.01 | 0.01 | 0.01 | 0.02 | 0.01 | 0.02 |
| pm25 | 4.1 | 4.7 | 7.2 | 6.7 | 9.6 | 8.3 | 5.9 | 6 | 4.6 | 5.6 | 5.4 | 5 | 14 | 4.8 | 10 | 11 | 8.7 | 8 | 8.8 | 6.8 | 6.5 | 39 |
Calgary Northwest
| index | 2020-05 | 2020-04 | 2020-03 | 2020-02 | 2020-01 | 2019-12 | 2019-11 | 2019-10 | 2019-09 | 2019-08 | 2019-07 | 2019-06 | 2019-05 | 2019-04 | 2019-03 | 2019-02 | 2019-01 | 2018-12 | 2018-11 | 2018-10 | 2018-09 | 2018-08 | 2018-07 | 2018-06 | 2018-05 | 2018-04 | 2018-03 | 2018-02 | 2018-01 | 2017-12 | 2017-11 | 2017-10 | 2017-09 | 2017-08 | 2017-07 | 2017-06 | 2017-05 | 2017-04 | 2016-09 | 2016-08 | 2016-04 | 2016-03 |
|---|---|---|---|---|---|---|---|---|---|---|---|---|---|---|---|---|---|---|---|---|---|---|---|---|---|---|---|---|---|---|---|---|---|---|---|---|---|---|---|---|---|---|
| o3:ppm | 0.04 | 0.04 | 0.03 | 0.02 | 0.02 | 0.02 | 0.02 | 0.02 | 0.02 | 0.03 | 0.03 | 0.03 | 0.03 | 0.04 | 0.03 | 0.02 | 0.02 | 0.02 | 0.02 | 0.02 | 0.02 | 0.03 | 0.04 | 0.04 | 0.04 | 0.04 | 0.03 | 0.03 | 0.02 | 0.02 | 0.02 | 0.02 | 0.03 | 0.03 | 0.04 | 0.03 | 0.03 | 0.03 | 0.02 | 0.02 | 0.04 | 0.03 |
| pm25 | 6.1 | 5.1 | 5.9 | 4.5 | 6.5 | 4.4 | 3.4 | 6.9 | 5.2 | 6.3 | 5.6 | 5.3 | 11 | 3.8 | 9.3 | 9.8 | 5.2 | 4.4 | 4.9 | 5.3 | 6.8 | 44 | 9.1 | 5 | 7.4 | 9.3 | 15 | 3.5 | 5.8 | 4.8 | 11 | 3.6 | 11 | 19 | 14 | 5 | 3.6 | 4.3 | - | 5.1 | 1.9 | 3.4 |
| no2:ppm | 0 | 0 | 0.01 | 0.01 | 0.02 | 0.02 | 0.01 | 0.01 | 0.01 | 0 | 0 | 0 | 0.01 | 0.01 | 0.01 | 0.02 | 0.02 | 0.02 | 0.02 | 0.01 | 0.01 | 0.01 | 0 | 0 | 0.01 | 0.01 | 0.02 | 0.01 | 0.02 | 0.01 | 0.02 | 0.01 | 0.01 | 0.01 | 0.01 | 0 | 0.01 | 0.01 | 0 | 0.01 | - | 0.01 |
| co:ppm | 0.22 | 0.29 | 0.43 | 0.38 | 0.46 | 0.48 | 0.4 | 0.37 | 0.27 | 0.19 | 0.09 | 0.14 | 0.22 | 0.2 | 0.34 | 0.3 | 0.47 | 0.35 | 0.64 | 0.47 | 0.3 | 0.46 | 0.16 | 0.09 | 0.08 | 0.07 | 0.59 | 0.2 | 0.22 | 0.23 | 0.24 | 0.17 | 0.24 | 0.3 | 0.06 | 0.05 | 0.05 | 0.02 | 0.15 | 0.19 | 0.45 | 0.28 |