Air Pollution in city center: Real-time Air Quality Index and smog alert.
Pollution and air quality forecast for city center. Today is Thursday, June 25, 2026. The following air pollution values have been recorded for city center:- nitrogen dioxide (NO2) - 2 (Good)
- sulfur dioxide (SO2) - 7 (Good)
- ozone (O3) - 64 (Good)
- particulate matter (PM10) suspended dust - 13 (Good)
- particulate matter (PM2.5) dust - 6 (Good)
- carbon monoxide (CO) - 600 (Good)

What is the air quality in city center today? Is the air polluted in city center?. Is there smog?
How high is the level of NO2? (nitrogen dioxide (NO2))
2 (Good)
What is the level of SO2 pollution? (sulfur dioxide (SO2))
7 (Good)
How is the O3 level today in city center? (ozone (O3))
64 (Good)
What is the level of PM10 today in city center? (particulate matter (PM10) suspended dust)
The current level of particulate matter PM10 in city center is:
13 (Good)
The highest PM10 values usually occur in month: 109 (February 2020).
The lowest value of particulate matter PM10 pollution in city center is usually recorded in: July (13).
What is the current level of PM2.5 in city center? (particulate matter (PM2.5) dust)
Today's PM2.5 level is:
6 (Good)
For comparison, the highest level of PM2.5 in city center in the last 7 days was: 11 (Wednesday, May 24, 2023) and the lowest: 5 (Monday, May 29, 2023).
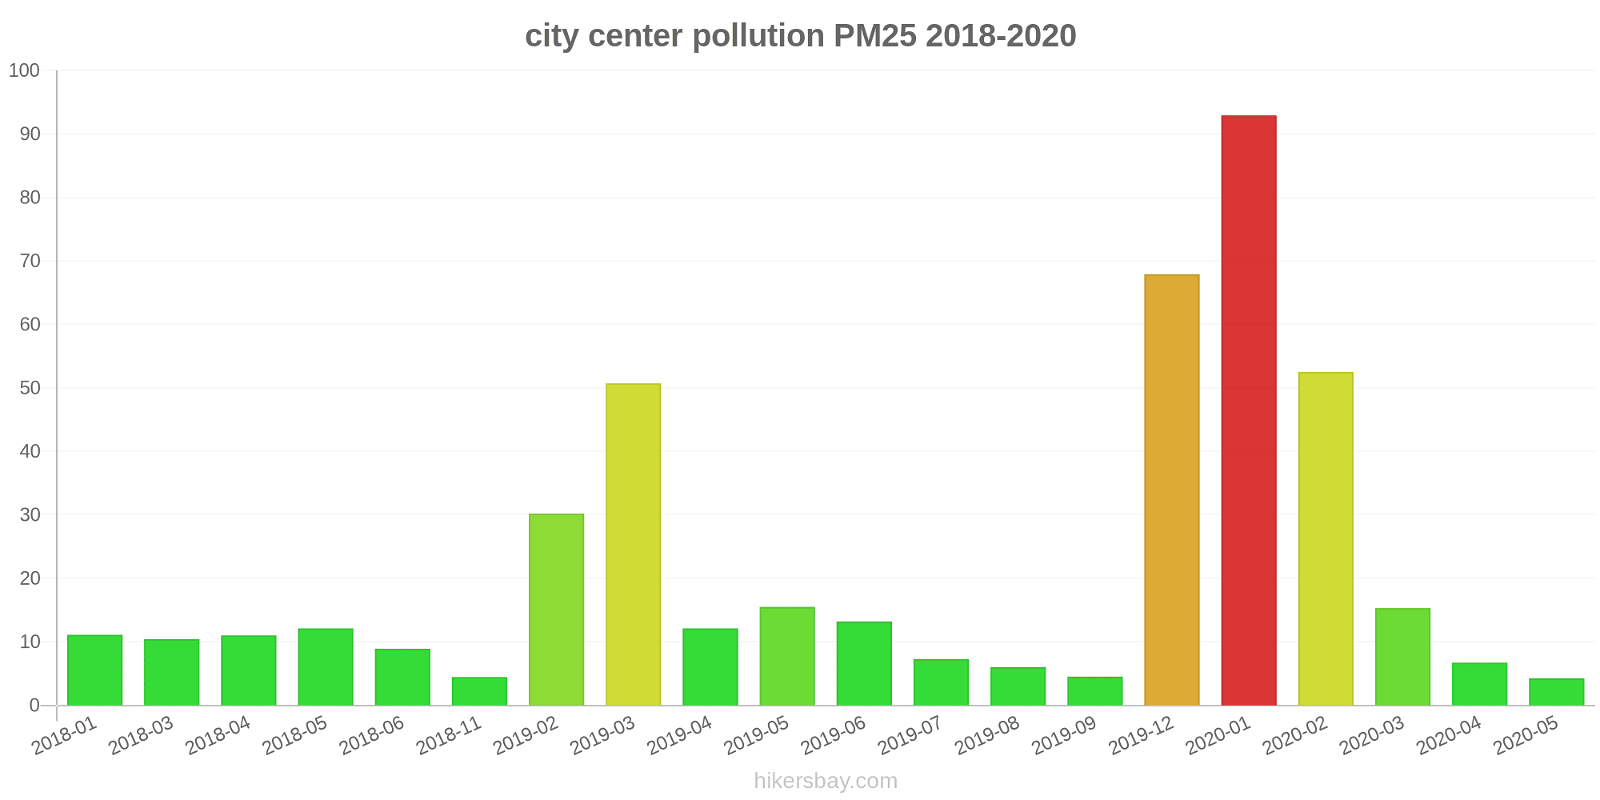
The highest PM2.5 values were recorded: 93 (January 2020).
The lowest level of particulate matter PM2.5 pollution occurs in month: May (4.3).
How high is the CO level? (carbon monoxide (CO))
600 (Good)
Current data Wednesday, May 31, 2023, 4:00 AM
NO2 2 (Good)
SO2 7 (Good)
O3 64 (Good)
PM10 13 (Good)
PM2,5 6 (Good)
CO 600 (Good)
2 (Good)
Data on air pollution from recent days in city center
index
2023-05-24
2023-05-25
2023-05-26
2023-05-27
2023-05-28
2023-05-29
2023-05-30
2023-05-31
pm25
11
Good
11
Good
10
Good
7
Good
7
Good
5
Good
6
Good
6
Good
pm10
26
Moderate
28
Moderate
24
Moderate
13
Good
11
Good
11
Good
15
Good
11
Good
co
608
Good
629
Good
608
Good
613
Good
596
Good
592
Good
563
Good
600
Good
so2
5
Good
6
Good
6
Good
7
Good
6
Good
7
Good
7
Good
7
Good
o3
78
Moderate
75
Moderate
67
Good
63
Good
51
Good
49
Good
58
Good
63
Good
no2
9
Good
11
Good
9
Good
7
Good
11
Good
12
Good
3
Good
2
Good
no
4
Good
4
Good
4
Good
3
Good
3
Good
5
Good
2
Good
2
Good
data source »
Air pollution in city center from September 2017 to May 2020
index
2020-05
2020-04
2020-03
2020-02
2020-01
2019-12
2019-09
2019-08
2019-07
2019-06
2019-05
2019-04
2019-03
2019-02
2018-11
2018-06
2018-05
2018-04
2018-03
2018-01
2017-10
2017-09
pm25
4.3 (Good)
6.7 (Good)
15 (Moderate)
53 (Unhealthy for Sensitive Groups)
93 (Very Unhealthy)
68 (Unhealthy)
4.5 (Good)
6 (Good)
7.3 (Good)
13 (Moderate)
16 (Moderate)
12 (Good)
51 (Unhealthy for Sensitive Groups)
30 (Moderate)
4.5 (Good)
8.9 (Good)
12 (Good)
11 (Good)
10 (Good)
11 (Good)
- (Good)
- (Good)
so2
2 (Good)
3.1 (Good)
4.9 (Good)
4.4 (Good)
3.1 (Good)
- (Good)
3.9 (Good)
3.5 (Good)
3.2 (Good)
5 (Good)
4.1 (Good)
3.8 (Good)
4.5 (Good)
6 (Good)
2 (Good)
2.2 (Good)
28 (Good)
2.7 (Good)
2 (Good)
2.4 (Good)
4.6 (Good)
4.3 (Good)
no2
8.7 (Good)
9.7 (Good)
24 (Good)
29 (Good)
32 (Good)
- (Good)
6.7 (Good)
7.4 (Good)
7.7 (Good)
13 (Good)
16 (Good)
25 (Good)
30 (Good)
35 (Good)
26 (Good)
14 (Good)
13 (Good)
18 (Good)
24 (Good)
24 (Good)
21 (Good)
26 (Good)
pm10
24 (Moderate)
20 (Moderate)
38 (Moderate)
109 (Unhealthy)
28 (Moderate)
- (Good)
13 (Good)
13 (Good)
13 (Good)
20 (Moderate)
26 (Moderate)
19 (Good)
21 (Moderate)
63 (Unhealthy for Sensitive Groups)
16 (Good)
17 (Good)
23 (Moderate)
25 (Moderate)
24 (Moderate)
28 (Moderate)
- (Good)
- (Good)
co
- (Good)
211 (Good)
174 (Good)
10 (Good)
- (Good)
- (Good)
- (Good)
464 (Good)
254 (Good)
663 (Good)
594 (Good)
529 (Good)
489 (Good)
521 (Good)
169 (Good)
342 (Good)
100 (Good)
109 (Good)
121 (Good)
175 (Good)
282 (Good)
288 (Good)
o3
- (Good)
52 (Good)
75 (Moderate)
54 (Good)
47 (Good)
- (Good)
35 (Good)
25 (Good)
30 (Good)
56 (Good)
63 (Good)
63 (Good)
60 (Good)
51 (Good)
49 (Good)
50 (Good)
88 (Moderate)
74 (Moderate)
48 (Good)
59 (Good)
44 (Good)
41 (Good)
data source »
Quality of life in city center
Green and Parks in the City
city center
71%
Andorra: 69%
France: 61%
Italy: 53%
Switzerland: 76%
San Marino: 75%
particulate matter PM2.5
city center
6 (Good)
Pleasure of spending time in the city
city center
69%
Andorra: 84%
France: 68%
Italy: 56%
Switzerland: 84%
San Marino: 100%
particulate matter PM10
city center
19 (Good)
Air Pollution
city center
28%
Andorra: 29%
France: 36%
Italy: 50%
Switzerland: 20%
San Marino: 6.8%
Garbage Disposal
city center
65%
Andorra: 89%
France: 59%
Italy: 51%
Switzerland: 82%
Availability and quality of drinking water
city center
51%
Andorra: 100%
France: 73%
Italy: 69%
Switzerland: 90%
San Marino: 100%
Cleanliness and tidiness
city center
61%
Andorra: 75%
France: 48%
Italy: 45%
Switzerland: 82%
San Marino: 75%
Noise and Light pollution
city center
50%
Andorra: 29%
France: 54%
Italy: 48%
Switzerland: 38%
San Marino: 75%
Water Pollution
city center
43%
Andorra: 19%
France: 39%
Italy: 41%
Switzerland: 19%
San Marino: 0%
Source: Numbeo
ES1573A
Wednesday, May 31, 2023, 4:00 AM
NO2 2 (Good)
nitrogen dioxide (NO2)
SO2 7 (Good)
sulfur dioxide (SO2)
O3 64 (Good)
ozone (O3)
PM10 13 (Good)
particulate matter (PM10) suspended dust
PM2,5 6 (Good)
particulate matter (PM2.5) dust
CO 600 (Good)
carbon monoxide (CO)
2 (Good)
index_name_no
ES1573A
index
2023-05-31
2023-05-30
2023-05-29
2023-05-28
2023-05-27
2023-05-26
2023-05-25
2023-05-24
pm25
5.5
5.6
5.3
6.7
7.1
9.7
11
11
pm10
11
15
11
11
13
24
28
26
co
600
563
592
596
613
608
629
608
so2
7.2
7.1
6.7
6.4
7
6
6
5.2
o3
63
58
49
51
63
67
75
78
no2
2
2.6
12
11
7.1
8.8
11
8.8
no
2
2.4
5.2
3
2.7
4.5
4
4.1
ES1573A
2017-09 2020-05

index
2020-05
2020-04
2020-03
2020-02
2020-01
2019-12
2019-09
2019-08
2019-07
2019-06
2019-05
2019-04
2019-03
2019-02
2018-11
2018-06
2018-05
2018-04
2018-03
2018-01
2017-10
2017-09
co
-
211
174
10
-
-
-
464
254
663
594
529
489
521
169
342
100
109
121
175
282
288
so2
2
3.1
4.9
4.4
3.1
-
3.9
3.5
3.2
5
4.1
3.8
4.5
6
2
2.2
28
2.7
2
2.4
4.6
4.3
no2
8.7
9.7
24
29
32
-
6.7
7.4
7.7
13
16
25
30
35
26
14
13
18
24
24
21
26
o3
-
52
75
54
47
-
35
25
30
56
63
63
60
51
49
50
88
74
48
59
44
41
pm25
4.3
6.7
15
53
93
68
4.5
6
7.3
13
16
12
51
30
4.5
8.9
12
11
10
11
-
-
pm10
24
20
38
109
28
-
13
13
13
20
26
19
21
63
16
17
23
25
24
28
-
-
* Pollution data source:
https://openaq.org
(EEA Spain)
The data is licensed under CC-By 4.0
NO2 2 (Good)
SO2 7 (Good)
O3 64 (Good)
PM10 13 (Good)
PM2,5 6 (Good)
CO 600 (Good)
2 (Good)
Data on air pollution from recent days in city center
| index | 2023-05-24 | 2023-05-25 | 2023-05-26 | 2023-05-27 | 2023-05-28 | 2023-05-29 | 2023-05-30 | 2023-05-31 |
|---|---|---|---|---|---|---|---|---|
| pm25 | 11 Good |
11 Good |
10 Good |
7 Good |
7 Good |
5 Good |
6 Good |
6 Good |
| pm10 | 26 Moderate |
28 Moderate |
24 Moderate |
13 Good |
11 Good |
11 Good |
15 Good |
11 Good |
| co | 608 Good |
629 Good |
608 Good |
613 Good |
596 Good |
592 Good |
563 Good |
600 Good |
| so2 | 5 Good |
6 Good |
6 Good |
7 Good |
6 Good |
7 Good |
7 Good |
7 Good |
| o3 | 78 Moderate |
75 Moderate |
67 Good |
63 Good |
51 Good |
49 Good |
58 Good |
63 Good |
| no2 | 9 Good |
11 Good |
9 Good |
7 Good |
11 Good |
12 Good |
3 Good |
2 Good |
| no | 4 Good |
4 Good |
4 Good |
3 Good |
3 Good |
5 Good |
2 Good |
2 Good |

| index | 2020-05 | 2020-04 | 2020-03 | 2020-02 | 2020-01 | 2019-12 | 2019-09 | 2019-08 | 2019-07 | 2019-06 | 2019-05 | 2019-04 | 2019-03 | 2019-02 | 2018-11 | 2018-06 | 2018-05 | 2018-04 | 2018-03 | 2018-01 | 2017-10 | 2017-09 |
|---|---|---|---|---|---|---|---|---|---|---|---|---|---|---|---|---|---|---|---|---|---|---|
| pm25 | 4.3 (Good) | 6.7 (Good) | 15 (Moderate) | 53 (Unhealthy for Sensitive Groups) | 93 (Very Unhealthy) | 68 (Unhealthy) | 4.5 (Good) | 6 (Good) | 7.3 (Good) | 13 (Moderate) | 16 (Moderate) | 12 (Good) | 51 (Unhealthy for Sensitive Groups) | 30 (Moderate) | 4.5 (Good) | 8.9 (Good) | 12 (Good) | 11 (Good) | 10 (Good) | 11 (Good) | - (Good) | - (Good) |
| so2 | 2 (Good) | 3.1 (Good) | 4.9 (Good) | 4.4 (Good) | 3.1 (Good) | - (Good) | 3.9 (Good) | 3.5 (Good) | 3.2 (Good) | 5 (Good) | 4.1 (Good) | 3.8 (Good) | 4.5 (Good) | 6 (Good) | 2 (Good) | 2.2 (Good) | 28 (Good) | 2.7 (Good) | 2 (Good) | 2.4 (Good) | 4.6 (Good) | 4.3 (Good) |
| no2 | 8.7 (Good) | 9.7 (Good) | 24 (Good) | 29 (Good) | 32 (Good) | - (Good) | 6.7 (Good) | 7.4 (Good) | 7.7 (Good) | 13 (Good) | 16 (Good) | 25 (Good) | 30 (Good) | 35 (Good) | 26 (Good) | 14 (Good) | 13 (Good) | 18 (Good) | 24 (Good) | 24 (Good) | 21 (Good) | 26 (Good) |
| pm10 | 24 (Moderate) | 20 (Moderate) | 38 (Moderate) | 109 (Unhealthy) | 28 (Moderate) | - (Good) | 13 (Good) | 13 (Good) | 13 (Good) | 20 (Moderate) | 26 (Moderate) | 19 (Good) | 21 (Moderate) | 63 (Unhealthy for Sensitive Groups) | 16 (Good) | 17 (Good) | 23 (Moderate) | 25 (Moderate) | 24 (Moderate) | 28 (Moderate) | - (Good) | - (Good) |
| co | - (Good) | 211 (Good) | 174 (Good) | 10 (Good) | - (Good) | - (Good) | - (Good) | 464 (Good) | 254 (Good) | 663 (Good) | 594 (Good) | 529 (Good) | 489 (Good) | 521 (Good) | 169 (Good) | 342 (Good) | 100 (Good) | 109 (Good) | 121 (Good) | 175 (Good) | 282 (Good) | 288 (Good) |
| o3 | - (Good) | 52 (Good) | 75 (Moderate) | 54 (Good) | 47 (Good) | - (Good) | 35 (Good) | 25 (Good) | 30 (Good) | 56 (Good) | 63 (Good) | 63 (Good) | 60 (Good) | 51 (Good) | 49 (Good) | 50 (Good) | 88 (Moderate) | 74 (Moderate) | 48 (Good) | 59 (Good) | 44 (Good) | 41 (Good) |
Green and Parks in the City
city center 71%
Andorra: 69% France: 61% Italy: 53% Switzerland: 76% San Marino: 75%particulate matter PM2.5
city center 6 (Good)
Pleasure of spending time in the city
city center 69%
Andorra: 84% France: 68% Italy: 56% Switzerland: 84% San Marino: 100%particulate matter PM10
city center 19 (Good)
Air Pollution
city center 28%
Andorra: 29% France: 36% Italy: 50% Switzerland: 20% San Marino: 6.8%Garbage Disposal
city center 65%
Andorra: 89% France: 59% Italy: 51% Switzerland: 82%Availability and quality of drinking water
city center 51%
Andorra: 100% France: 73% Italy: 69% Switzerland: 90% San Marino: 100%Cleanliness and tidiness
city center 61%
Andorra: 75% France: 48% Italy: 45% Switzerland: 82% San Marino: 75%Noise and Light pollution
city center 50%
Andorra: 29% France: 54% Italy: 48% Switzerland: 38% San Marino: 75%Water Pollution
city center 43%
Andorra: 19% France: 39% Italy: 41% Switzerland: 19% San Marino: 0%NO2 2 (Good)
nitrogen dioxide (NO2)SO2 7 (Good)
sulfur dioxide (SO2)O3 64 (Good)
ozone (O3)PM10 13 (Good)
particulate matter (PM10) suspended dustPM2,5 6 (Good)
particulate matter (PM2.5) dustCO 600 (Good)
carbon monoxide (CO)2 (Good)
index_name_noES1573A
| index | 2023-05-31 | 2023-05-30 | 2023-05-29 | 2023-05-28 | 2023-05-27 | 2023-05-26 | 2023-05-25 | 2023-05-24 |
|---|---|---|---|---|---|---|---|---|
| pm25 | 5.5 | 5.6 | 5.3 | 6.7 | 7.1 | 9.7 | 11 | 11 |
| pm10 | 11 | 15 | 11 | 11 | 13 | 24 | 28 | 26 |
| co | 600 | 563 | 592 | 596 | 613 | 608 | 629 | 608 |
| so2 | 7.2 | 7.1 | 6.7 | 6.4 | 7 | 6 | 6 | 5.2 |
| o3 | 63 | 58 | 49 | 51 | 63 | 67 | 75 | 78 |
| no2 | 2 | 2.6 | 12 | 11 | 7.1 | 8.8 | 11 | 8.8 |
| no | 2 | 2.4 | 5.2 | 3 | 2.7 | 4.5 | 4 | 4.1 |
ES1573A

| index | 2020-05 | 2020-04 | 2020-03 | 2020-02 | 2020-01 | 2019-12 | 2019-09 | 2019-08 | 2019-07 | 2019-06 | 2019-05 | 2019-04 | 2019-03 | 2019-02 | 2018-11 | 2018-06 | 2018-05 | 2018-04 | 2018-03 | 2018-01 | 2017-10 | 2017-09 |
|---|---|---|---|---|---|---|---|---|---|---|---|---|---|---|---|---|---|---|---|---|---|---|
| co | - | 211 | 174 | 10 | - | - | - | 464 | 254 | 663 | 594 | 529 | 489 | 521 | 169 | 342 | 100 | 109 | 121 | 175 | 282 | 288 |
| so2 | 2 | 3.1 | 4.9 | 4.4 | 3.1 | - | 3.9 | 3.5 | 3.2 | 5 | 4.1 | 3.8 | 4.5 | 6 | 2 | 2.2 | 28 | 2.7 | 2 | 2.4 | 4.6 | 4.3 |
| no2 | 8.7 | 9.7 | 24 | 29 | 32 | - | 6.7 | 7.4 | 7.7 | 13 | 16 | 25 | 30 | 35 | 26 | 14 | 13 | 18 | 24 | 24 | 21 | 26 |
| o3 | - | 52 | 75 | 54 | 47 | - | 35 | 25 | 30 | 56 | 63 | 63 | 60 | 51 | 49 | 50 | 88 | 74 | 48 | 59 | 44 | 41 |
| pm25 | 4.3 | 6.7 | 15 | 53 | 93 | 68 | 4.5 | 6 | 7.3 | 13 | 16 | 12 | 51 | 30 | 4.5 | 8.9 | 12 | 11 | 10 | 11 | - | - |
| pm10 | 24 | 20 | 38 | 109 | 28 | - | 13 | 13 | 13 | 20 | 26 | 19 | 21 | 63 | 16 | 17 | 23 | 25 | 24 | 28 | - | - |